Analyzing and Enhancing Vessel Schedule Data
The value of the global cargo shipping industry is estimated to be in the billions> of dollars, and it only grew last year as lockdowns and quarantines drove up the demand for delivered consumer goods. With the global pandemic disrupting supply chains everywhere, we at GA-CCRi were interested to investigate the reliability of shipping schedules. To do this, we partnered with global carrier aggregator Linescape. Linescape provides daily vessel schedules that are aggregated from hundreds of carriers and describe the cargo vessels’ next ports and expected arrivals.
Data
There were two different sets of data used in this analysis. The first is the aforementioned Linescape data. These vessel schedules were updated daily and each spans a time of a few months. Each Linescape schedule represents a set of ports the vessel will travel between, with estimated arrivals and departures from those ports. Vessels are represented multiple times in the data set, both by different carriers, and by different schedules within the same carrier’s logs. Usually, as voyages grow nearer, the schedule will be updated as adjustments are made due to delays or changed plans.
The other source of data is Automatic Identification System data (AIS), which vessels transmit constantly to communicate with other vessels. Sensors across the world collect this data, creating a global picture of vessel locations. Our AIS feed is provided by exactEarth.

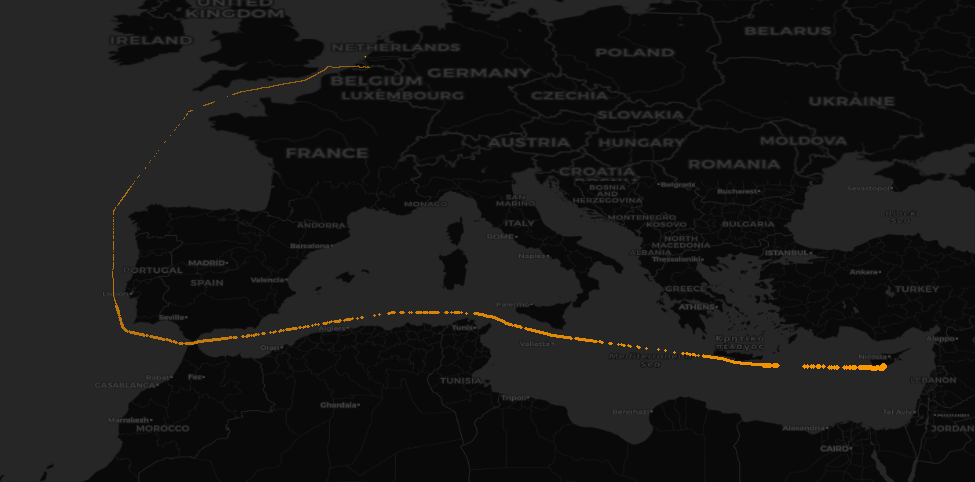
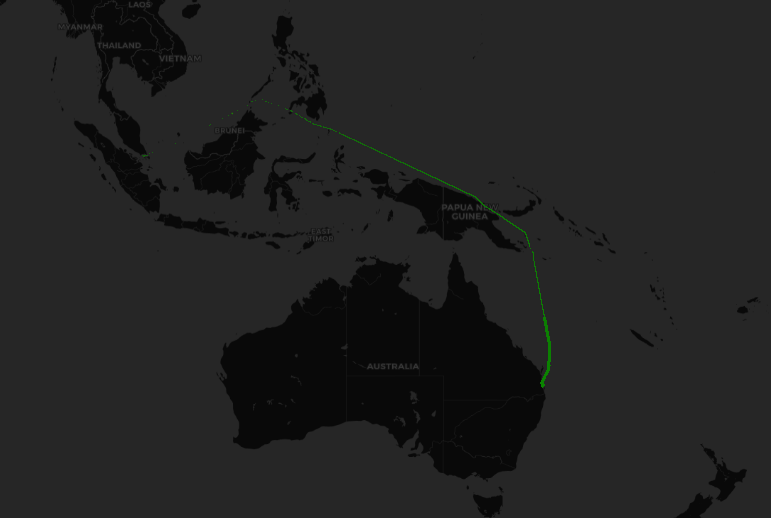
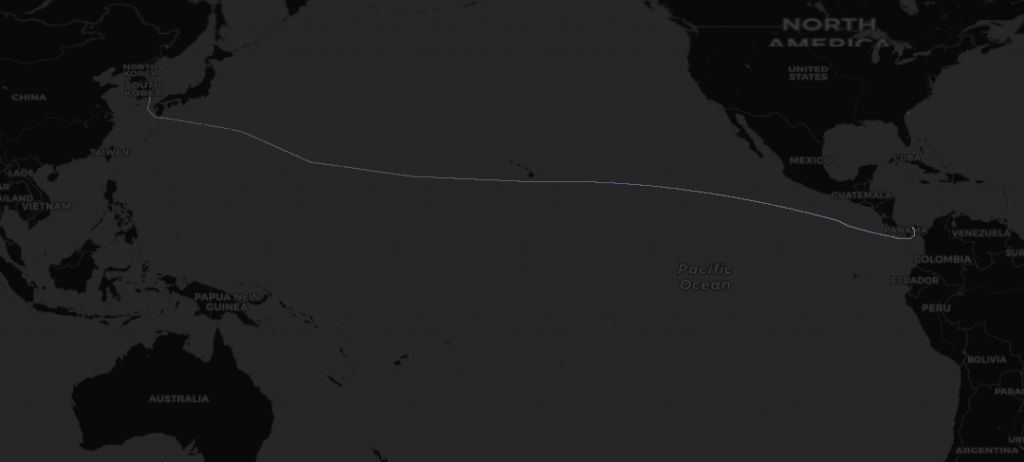
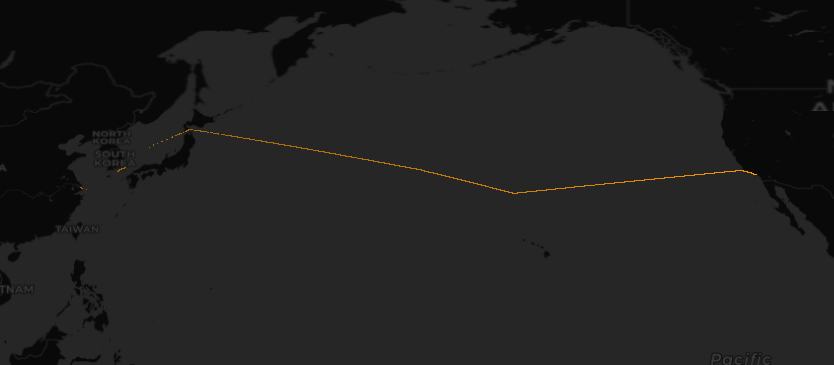
In order to combine these two disparate data sources, we developed a custom set of route map layers using AIS. Using our previously generated port boundaries, we were able to create a maritime super highway by extracting exemplar tracks from port to port and using them as a basis for a set of routes from port to port.
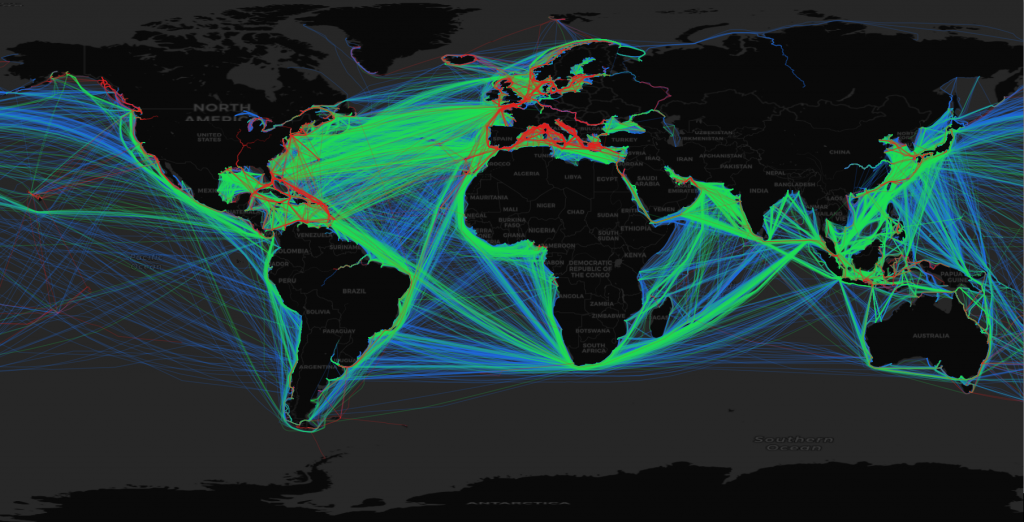
Using this, we can aggregate data by route and perform analytics based on the vessels’ locations along these routes.
Scheduled Arrivals vs. Actual Arrivals
At first, we were mainly curious at how accurate the schedules were at any given point in time. For this comparison, we decided to focus on a few major trade routes.
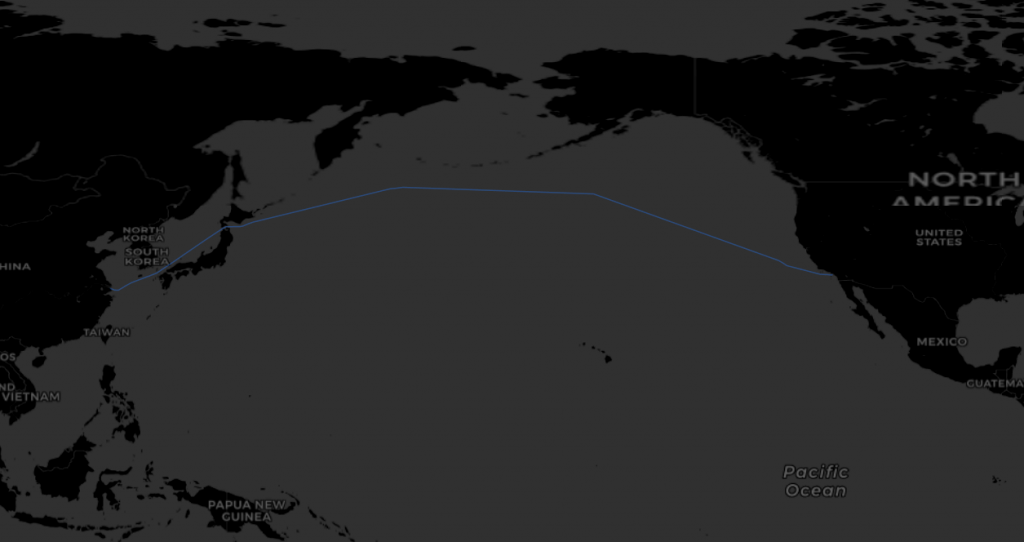
Using Linescape data and our routes, we retrieved data about a set of vessels that were scheduled to travel from Shanghai to LA on November 12th, 2021. Using exactEarth data and our Port Boundary Layer, we calculated arrivals of the vessels and then compared this to what the schedule communicated. We could then evaluate the accuracy of the schedules.
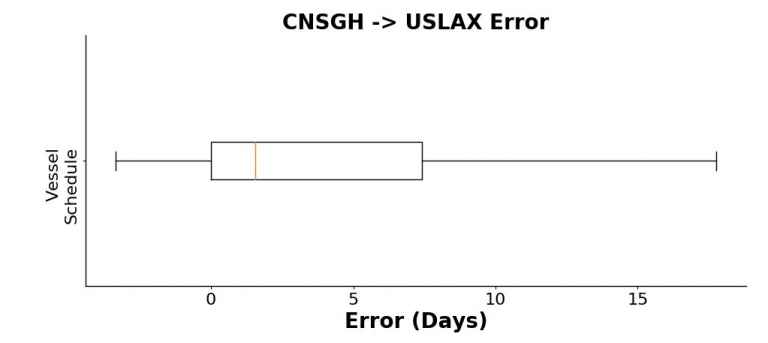
This route was placed under particular strain over the past year, as factories in China amped up production to meet the demand of a quarantined world. As a result, our analysis reflected that vessels had a harder time maintaining their schedules. Vessels arrived at port about two days later than scheduled. Some even arrived as late as 18 days after their schedule.
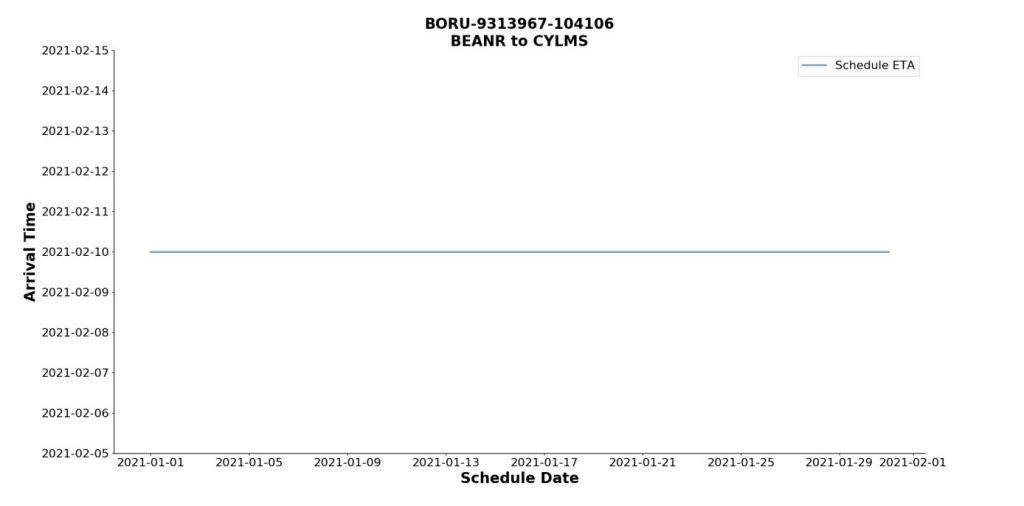
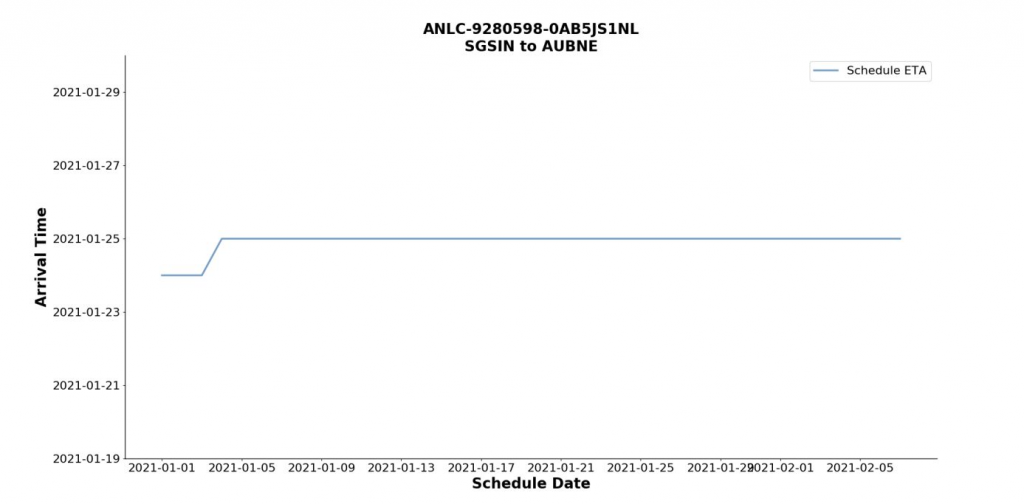
Linescape offers daily updates to each schedule. We were curious to see if the reliability of the schedules improved as they got closer to the departure date. To evaluate this, we looked at a set of randomly selected vessel schedules, filtering to only trips of over 10 days. Of the almost 500 vessel schedules we investigated, 87% had no change before their departure. Shown below is one of these vessels, with estimated arrival as the y axis and the date of the scheduled arrival on the x axis.
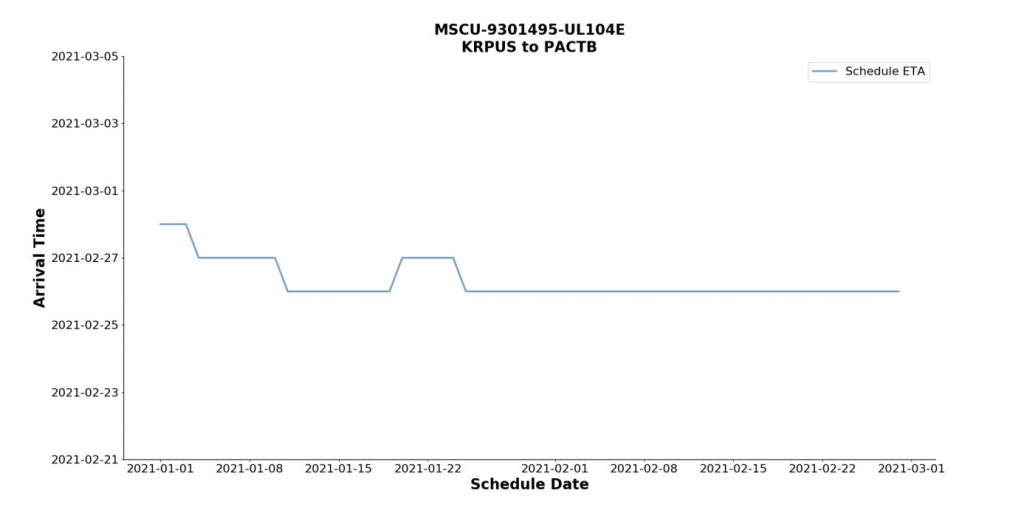
However, the remaining 13% of schedules had one or more changes to them. These varied from single changes to multiple repeated changes that occurred as frequently as once a day.
The schedules that did reflect some changes as departure approached were fairly accurate, but less accurate than those that were fixed. As would be expected, uncertainty represented by an updated schedule could indicate the carrier’s inability to predict the arrival.
These examples show some of the complexity of these schedules, highlighting the uncertainty inherent in global shipping patterns. In some cases, these schedules changed so radically that the journey originally scheduled did not even take place.
Scheduled Arrivals vs. Predicted Arrivals
Given the variability GA-CCRi was seeing in some of these routes, we were curious whether we could apply predictive methods to provide a forecast of arrival. GA-CCRi has access to years of historical AIS data, and we wanted to leverage this in order to predict when vessels would arrive at port. As mentioned above, we used this historical data to build a database of vessel routes given an origination and destination. We retrieved the past two months of data for vessels that were traveling along the Shanghai to Los Angeles route,and filtered out all the points that were within ports. We then built a speed profile for each vessel based on its history, with an average speed, as well as faster and slower traveling speeds (a standard deviation faster and slower, respectively). Using these, we could predict when vessels would arrive at port, from the moment of departure.
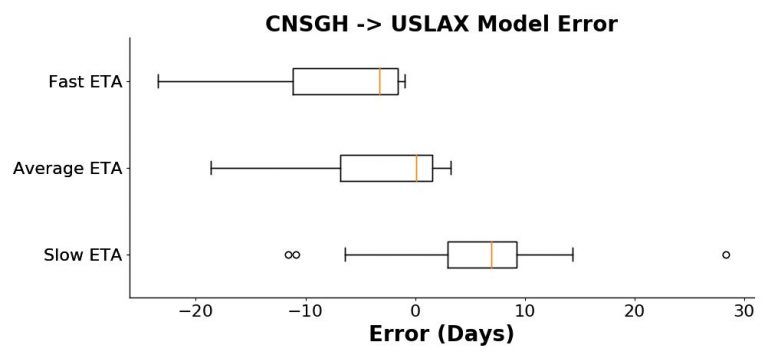
Notably, the model predictions tend to skew in the other direction than the vessel schedules. This is perhaps a result of carriers hedging on when their vessels will arrive. If it is generally worse for a vessel to arrive later rather than earlier, carriers could be giving themselves leeway in their predictions of when their vessels will arrive. An additional benefit to calculating ETA in this way is that distributions can be created for vessel arrivals, putting upper and lower bounds on their arrival times. This helps to quantify the uncertainty of schedules, so even when they are off, they’re off in predictable ways.
Zooming in on a specific example highlights how the kinematic model could be used to enhance the schedules. The vessel Cornelia I was scheduled to arrive at the Long Beach port on December 10th when it departed on November 27th, but it did not arrive until December 12th. The kinematic model, however, was able to place this ETA much more accurately, predicting an arrival shortly after midnight on December 12th.
As a first pass, these results are extremely encouraging. We are excited to explore the space further, improving the model and extending its capabilities to predict multiple voyages into the future.
The Future of Ship Arrival Predictions
Together, disparate sources of data can tell a story that individually they all fall short on. The schedules Linescape provided are extremely helpful when trying to accurately predict when vessels will arrive in port. When global conditions start to affect the arrival times, we believe kinematic predictions help to enhance the understanding of actual arrivals. If you’re a logistics provider or a vessel carrier who is interested in improving your predictability of on-time arrivals, scheduled data will definitely provide a big lift and can be further enhanced with predictive capabilities from GA-CCRi.