Outliers and Categorical Data
A few months ago on this blog my coworker Eric Nallon discussed our efforts to find anomalous visits to ports. There was a small technical detail mentioned in that post—that the first isolation forest we used did not work with categorical data and that we had to use a different algorithm as a result. Today we’ll discuss this in more detail to show why a scikit-learn isolation forest could not detect outliers for our data, how we realized that was the case, and how we fixed it.
Previously, on the GA-CCRi Blog
You can read more details about our work detecting outliers in port arrivals in Eric’s post, but to recap: we were looking to see if we could predict anomalous voyages. To do this, we initially tried to train an isolation forest on a set of voyages, using Automatic Identification System (AIS) data collected via our partners, ExactEarth. An isolation forest is an unsupervised outlier detection algorithm, which is useful for analyzing large and diverse data sets such as AIS data. It works by training multiple fine-grain decision trees on the data, with each tree ideally having a single point of data on each leaf. Below is a simple example decision tree with two numeric variables and three samples.
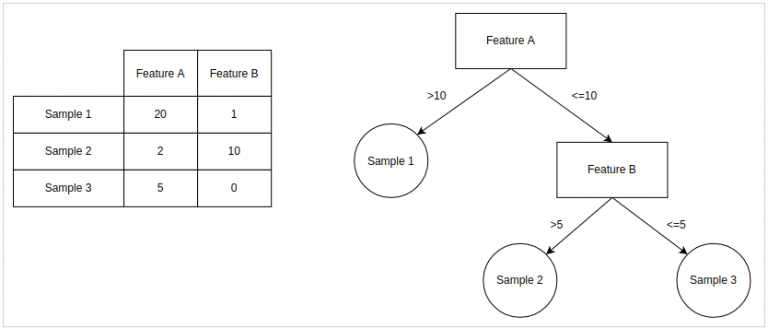
The higher up the tree a value is, the more likely it is to be an outlier. The logic is that points high up on the tree required fewer features to split them from the rest of the data, meaning that they are notably different from the rest of the data. In the example above, sample 1 would be considered more anomalous than sample 2 or 3. Repeating this process many times, the features that are truly anomalous will float to the top consistently, and a score for each sample can be determined. This was the method we decided to use to determine the outliers. We took the data, extracted country of origin, vessel type, length, and width as features, and passed it into the scikit-learn isolation forest.
The Problem
The first pass at an isolation forest left a lot to be desired. The results showed most vessels as being equally anomalous, regardless of their port of origin. This was highly unusual, since the data contained ships from ports around the world as well as ships from the same country of the port of interest. While investigating, we eventually realized the issue came from how the categorical variable of origin country was being incorporated in the isolation forest.
At the time, we were using one-hot encoding, which expands a categorical variable out into many different binary variables. For each category in the original data, one-hot encoding creates a new variable, which will be one if the original variable matched it and zero in all other cases.
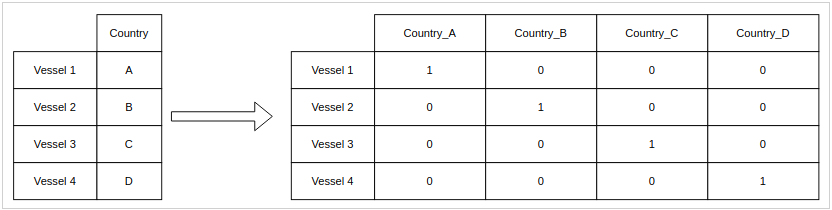
This translates features from categorical space into quantitative space in an intuitive way. However, it turns out that one-hot encoded features don’t actually provide useful information to the model. Because each country is one unit away from the origin, each point in this space will be the same distance away from points of the other countries. When the points are completely and totally equidistant, the ones that get marked as outliers will depend entirely on random chance.
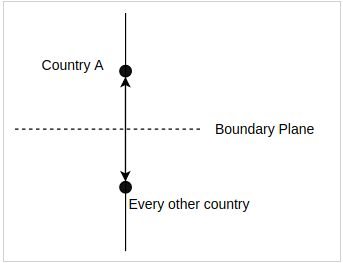
The end result is that in any given decision tree it is entirely arbitrary what countries are considered anomalous. This is obviously not ideal, since we were interested in each vessel’s origin and destination countries. So, we needed a new encoding system that would allow us to do this.
Our Solution
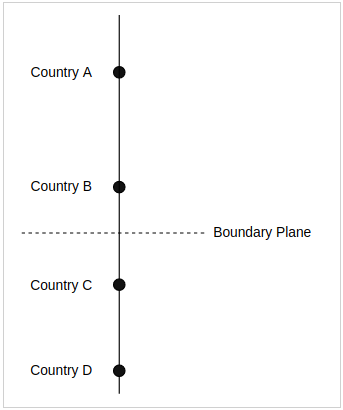
The solution for this issue came from the h2o.ai library, which is a machine learning library comparable to scikit-learn. This library uses enumerated encoding to store categorical variables. With enumerated encoding, each variable is mapped to an integer in one singular new feature. Compare this to one-hot encoding, which exploded out the variable into several different features for the model.
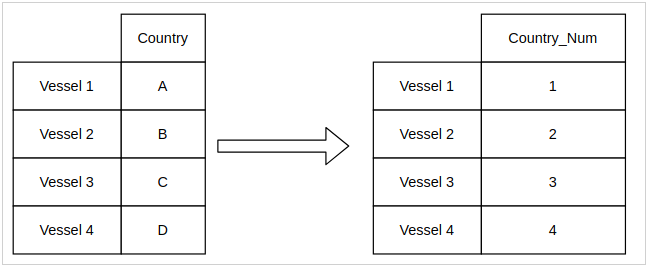
This encoding has an intuitive result: it adds order to data that didn’t have it before. It is nonsensical mathematically to say something like “India > France” or “Panama < Finland” but this method allows you to do that. Each country gets an arbitrary spot on the number line.
This paradoxically makes outlier detection easier, because even though it introduces some noise by arbitrarily ordering the countries, it de-emphasizes the importance of that variable. Rather than exploding the singular value of country out into several dozen binary variables, the value is represented by one variable. Decision trees, by design, take longer to reach points that are less isolated from their neighbors. Since common countries will group together directly on top of themselves, eventually the countries represented less often in the data will stand out because they require fewer tree splits on average to reach
Fixing the Algorithm
Models are not people, and data does not perfectly represent the real world. Just because a representation seems intuitive and mathematically correct for a set of data (like one-hot encoding on categorical data) does not necessarily make it the right choice. You have to dive down deeper, into the mechanics of the model, to be sure that what you are doing makes sense, and doing so can give you new ideas about new approaches to take.
If you enjoy the analysis of algorithms and models to find new ways to solve data science problems, you might like working with us at GA-CCRi. Get in touch with us!