New in GeoMesa: Spark SQL, Zeppelin Notebooks support, and more
Release 1.3 of GeoMesa has taken some great steps in making GeoMesa an even better analytics platform for Big Spatial Data. Many improvements fall into two categories: support for a wider range of Spark features and improved support for interactive notebooks such as Jupyter and Zeppelin.
For some time now, GeoMesa has supported Apache Spark for fast, distributed analytics, and Spark has included an SQL module since its early days. If you used this module to query geospatial data, though, standard SQL commands and functions would have a tough time calculating around the geometry of a curved earth. To help GeoMesa users get more out of Spark SQL, GA-CCRi’s GeoMesa team has recently added Spark SQL support for geospatial data types such as points, linestrings, and polygons, and they’ve developed a long list of new geospatial functions that you can now call from Spark SQL. For example, the st_intersects function tells you whether two geometries intersect; this could tell you whether an airplane’s flight path passed over a particular city.
For some time now, GeoMesa has supported Apache Spark for fast, distributed analytics, and Spark has included an SQL module since its early days. If you used this module to query geospatial data, though, standard SQL commands and functions would have a tough time calculating around the geometry of a curved earth. To help GeoMesa users get more out of Spark SQL, GA-CCRi’s GeoMesa team has recently added Spark SQL support for geospatial data types such as points, linestrings, and polygons, and they’ve developed a long list of new geospatial functions that you can now call from Spark SQL. For example, the st_intersects function tells you whether two geometries intersect; this could tell you whether an airplane’s flight path passed over a particular city.
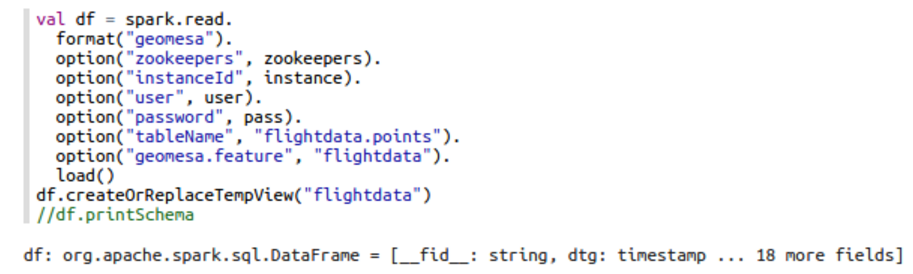
Here’s an example of geospatial Spark SQL in action. The following Scala code gets a DataFrame from GeoMesa Spark Accumulo for some flight data and creates a view called flightdata:
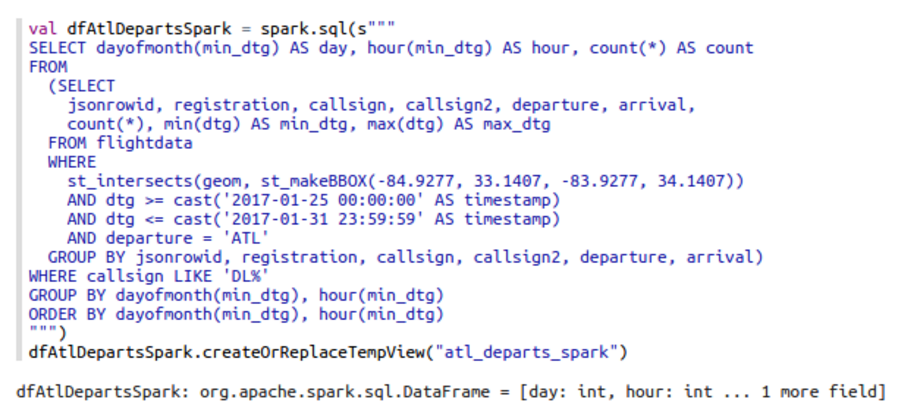
After doing this setup, it can query that view with SQL. Below we see a nested SQL query within Scala code that pulls some data out of the flightdata view. It requests all points for departing flights in an area around the Atlanta (ATL) airport, groups these by flight identifier, gets the earliest point for each, and aggregates by day and hour of departure:
Support for additional Spark SQL features such as SQL window functions opens up even more analytics possibilities for people familiar with SQL, letting them compute things like moving averages.
Writing and debugging powerful Spark SQL queries such as the one above is often an iterative process, and interactive web-based notebooks such as Jupyter and Zeppelin can be a big help. Last June’s blog entry GeoMesa analytics in a Jupyter notebook described how you can create and share interactive Jupyter notebooks of GeoMesa analytics Scala code, and GeoMesa release 1.3 adds support for Apache Zeppelin.
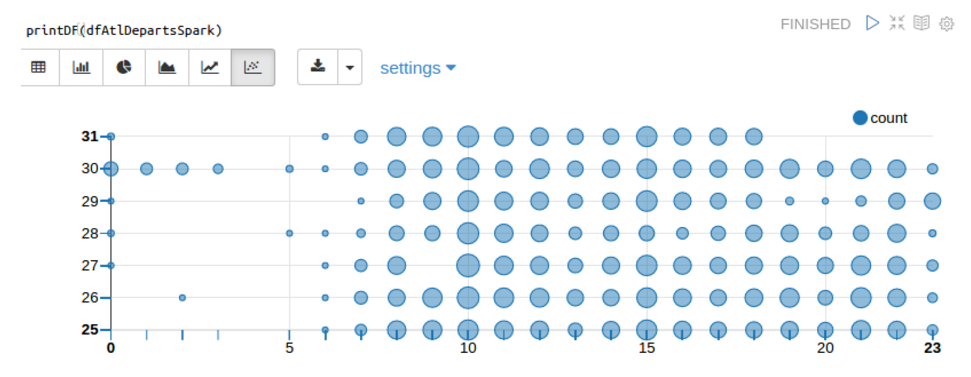
One nice feature of Zeppelin is Helium, its built-in visualization package. The following shows what Zeppelin and Helium can do with the results of the SQL query listed above. The size of each data point represents the number of Delta Airlines flights departing the ATL airport for a given day (y-axis) and hour (x-axis) in January 2017. The visualization shows an atypical drop in the number of departures between 19:00 (7 PM) and 21:00 (9 PM) on January 29 due to an outage of Delta’s computer systems:
GA-CCRi developers have also added hooks to let Scala and Python developers visualize geospatial data in Jupyter and Zeppelin with the Leaflet JavaScript interactive mapping library. For example, the Scala code below uses the data in several DataFrames produced by GeoMesa Spark to generate a map showing which flights in the data set crossed over the state of Wyoming:
When run in a Zeppelin notebook, this code produces the following map:
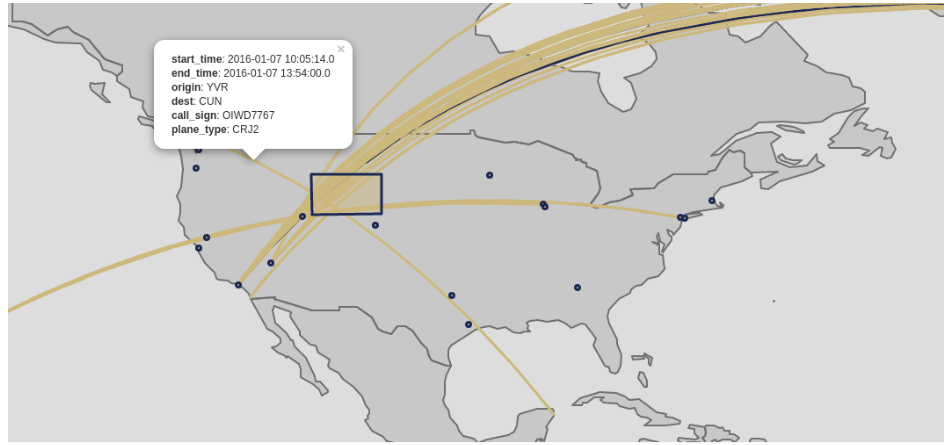
An advantage of creating the map this way is that it’s not a static image stored to disk; using the Leaflet library, the map produced is interactive and dynamic.
Along with support for Spark SQL and improved notebook visualizations, GeoMesa release 1.3 (and last week, 1.3.1) bring many other new capabilities to the GeoMesa community:
- Access to GeoMesa Spark features for Python developers
- Support for Apache NiFi, a graphical web-based tool that enables the automation of data flow between systems, which also makes Kafka integration easier
- The ability to let Spark read geospatial data from flat files such as XML, CSV and JSON (basically, anything you can write a GeoMesa converter configuration for) and work with them in Spark SQL
- More robust HBase, Google Bigtable, and Cassandra support
- A pluggable Spark backend, making it easier to seamlessly access geospatial data sets in Spark from multiple sources, including flat files, Accumulo, HBase, and Google Bigtable
What would you like to see added to GeoMesa? Let us know!