Steering Ships Around Hurricane Florence
The image below loops an animation of Optix.Earth’s rendition of ship traffic around the southeastern United States from Tuesday to Thursday of last week. It shows that all the ships are avoiding an area about 800 miles wide that was moving towards the North and South Carolina coast: Hurricane Florence.
exactEarth is a leading provider of global maritime vessel data for ship tracking and maritime situational awareness solutions. They pioneered a powerful new method of maritime surveillance called S-AIS to deliver data for maritime behaviours across all regions of the world’s oceans. This method collects AIS data from a collection of satellites, allowing the data to be unrestricted by terrestrial limitations often imposed by distance, weather, mountains, and other factors. Optix.Earth ingests this data and provides real time visualization of the ships’ locations. In this case, ships are color-coded by their country of origin; dark purple ships, which you can see more of traveling into and out of the Mississippi River, are registered in the U.S.
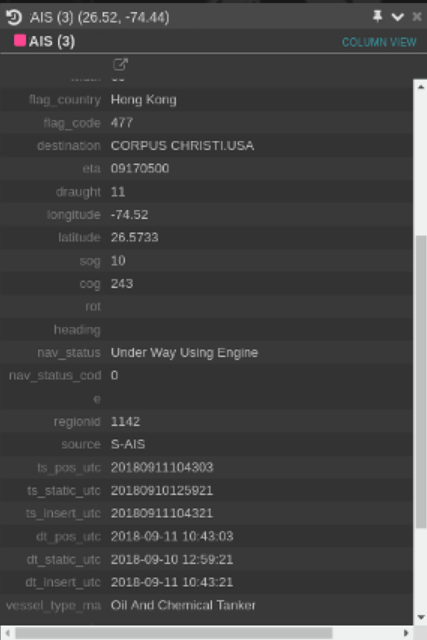
Clicking any dot on the Optix.Earth interface displays a panel with more information about that ship, as with this Hong Kong-based oil and chemical tanker bound for Corpus Christi:
This information can be used for more than just color-coding of the map markers. All of this data, along with position and tracking information, can be used to drive analytics that lead to more efficient forecasting and logistics planning. (For a more technical overview of some of the technologies that can drive such analytics and their impact on a particular industry, see last year’s blog entry Interactive Insights into Hurricane Harvey’s Impact on Energy Production with GeoMesa & Zeppelin Notebooks.)
Available data goes much further back than Tuesday. Below, you can see that on September 1st ships started to avoid the area above the words “Atlantic Ocean” and then avoided a bigger and bigger section of the ocean as that area moved east toward the U.S. As it got closer, a new area opens up in the same place: Hurricane Helene, which was headed north.
The speed of the slider that drives the animation can be easily controlled, and the automation doesn’t have to be automatic; you can drag it back and forth with a mouse for interactive exploration.
These visualizations are based on AIS data, but Optix.Earth can take advantage of and fuse data from a range of both real-time and historical sources. GA-CCRi’s production global-scale analytics can correlate and track entities across multiple sources of data and multiple modalities of data such as geospatial data, text, and imagery.
Want to learn more about how Optix.Earth can help you gain new insights from your spatio-temporal data? Fill out the form on https://optix.earth and we’ll be in touch.